

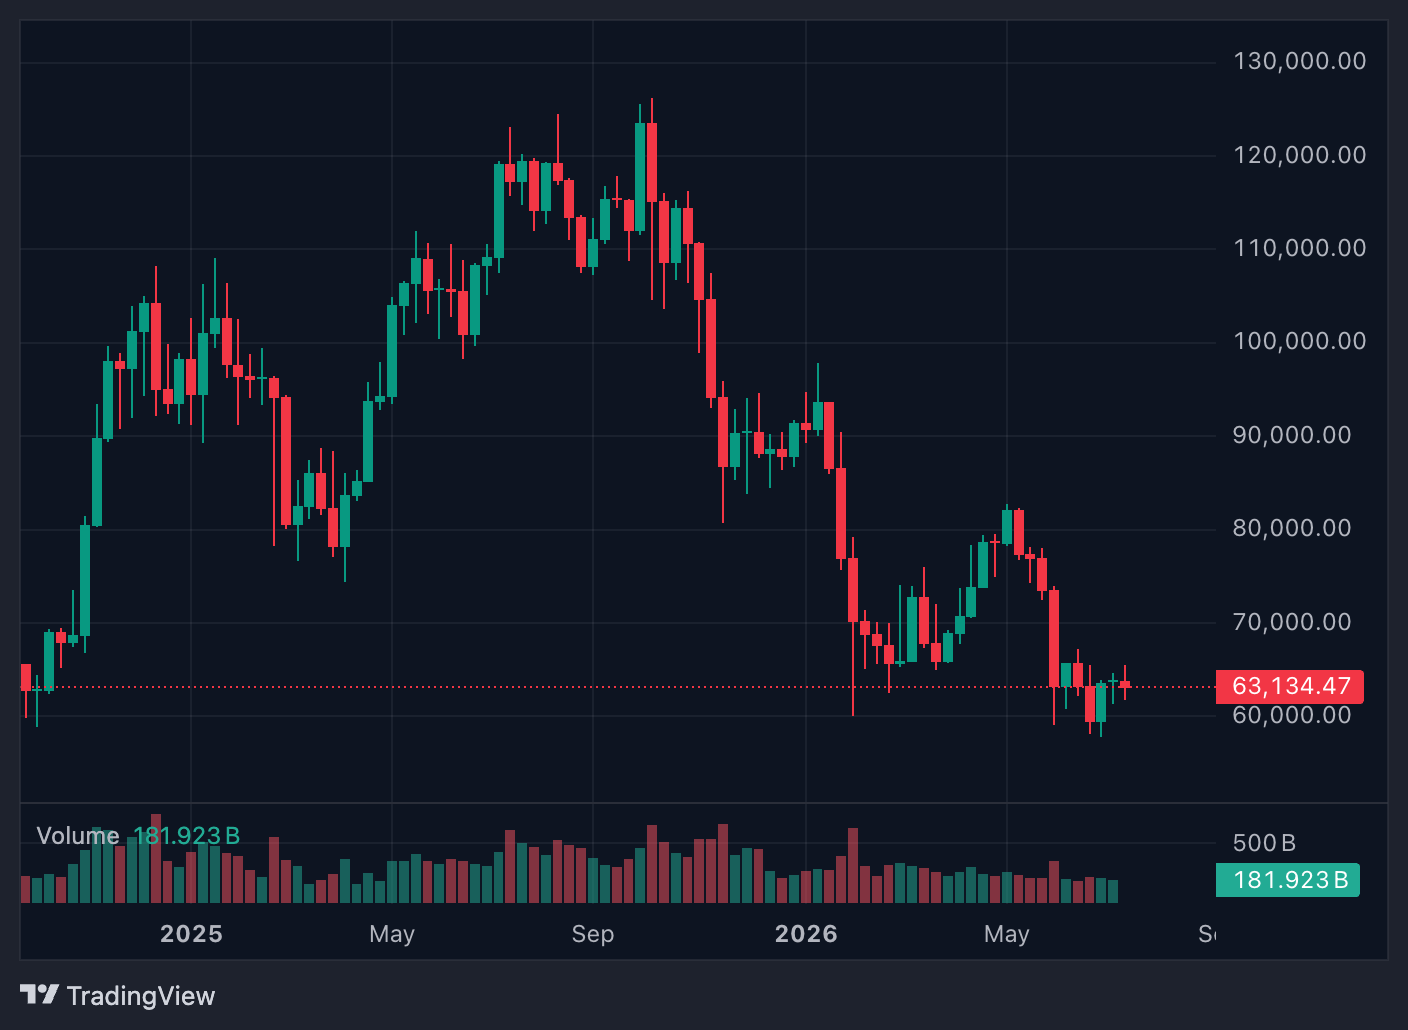
Since October of last year Bitcoin has dropped from an all time high of $126k touching down to as low as $57k. A drop of about 55% from top to bottom. Sentiment in Bitcoin is extremely low with many people believing that it will keep falling and may drop as far as the 40k range.
However, I believe we are closer than most people think to a bottom. I’ve created a dashboard which compiles various charts/signals to determine the optimal time to buy Bitcoin & MSTR: https://mstrvaluesignal.com/. Let’s walk through this dashboard and why now may be that optimal time.
Bitcoin
The dashboard uses the Power Law chart (log price scale) to determine when Bitcoin is high or low value based on the trend. Bitcoin has traded within this price range throughout it’s entire history.
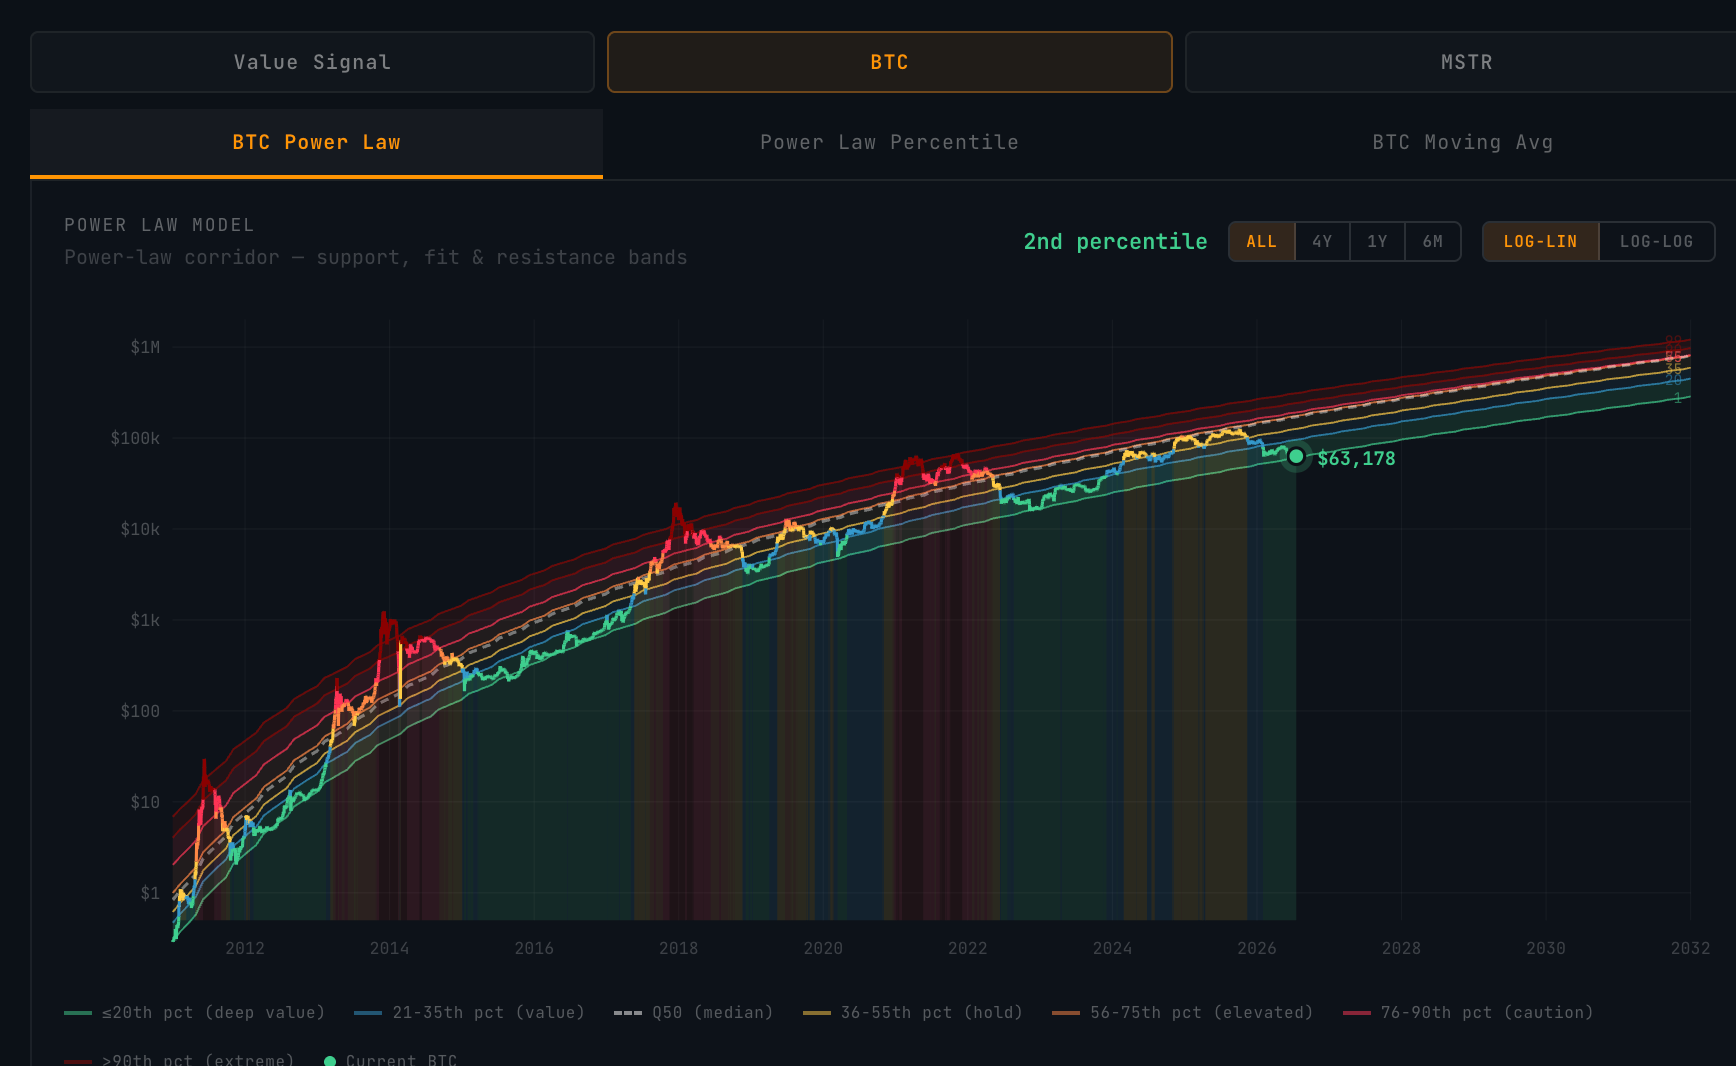
At the current price of $63k, Bitcoin is trading at the 2nd percentile of the Power Law. So it is extremely close to a bottom relative to this historical trend.
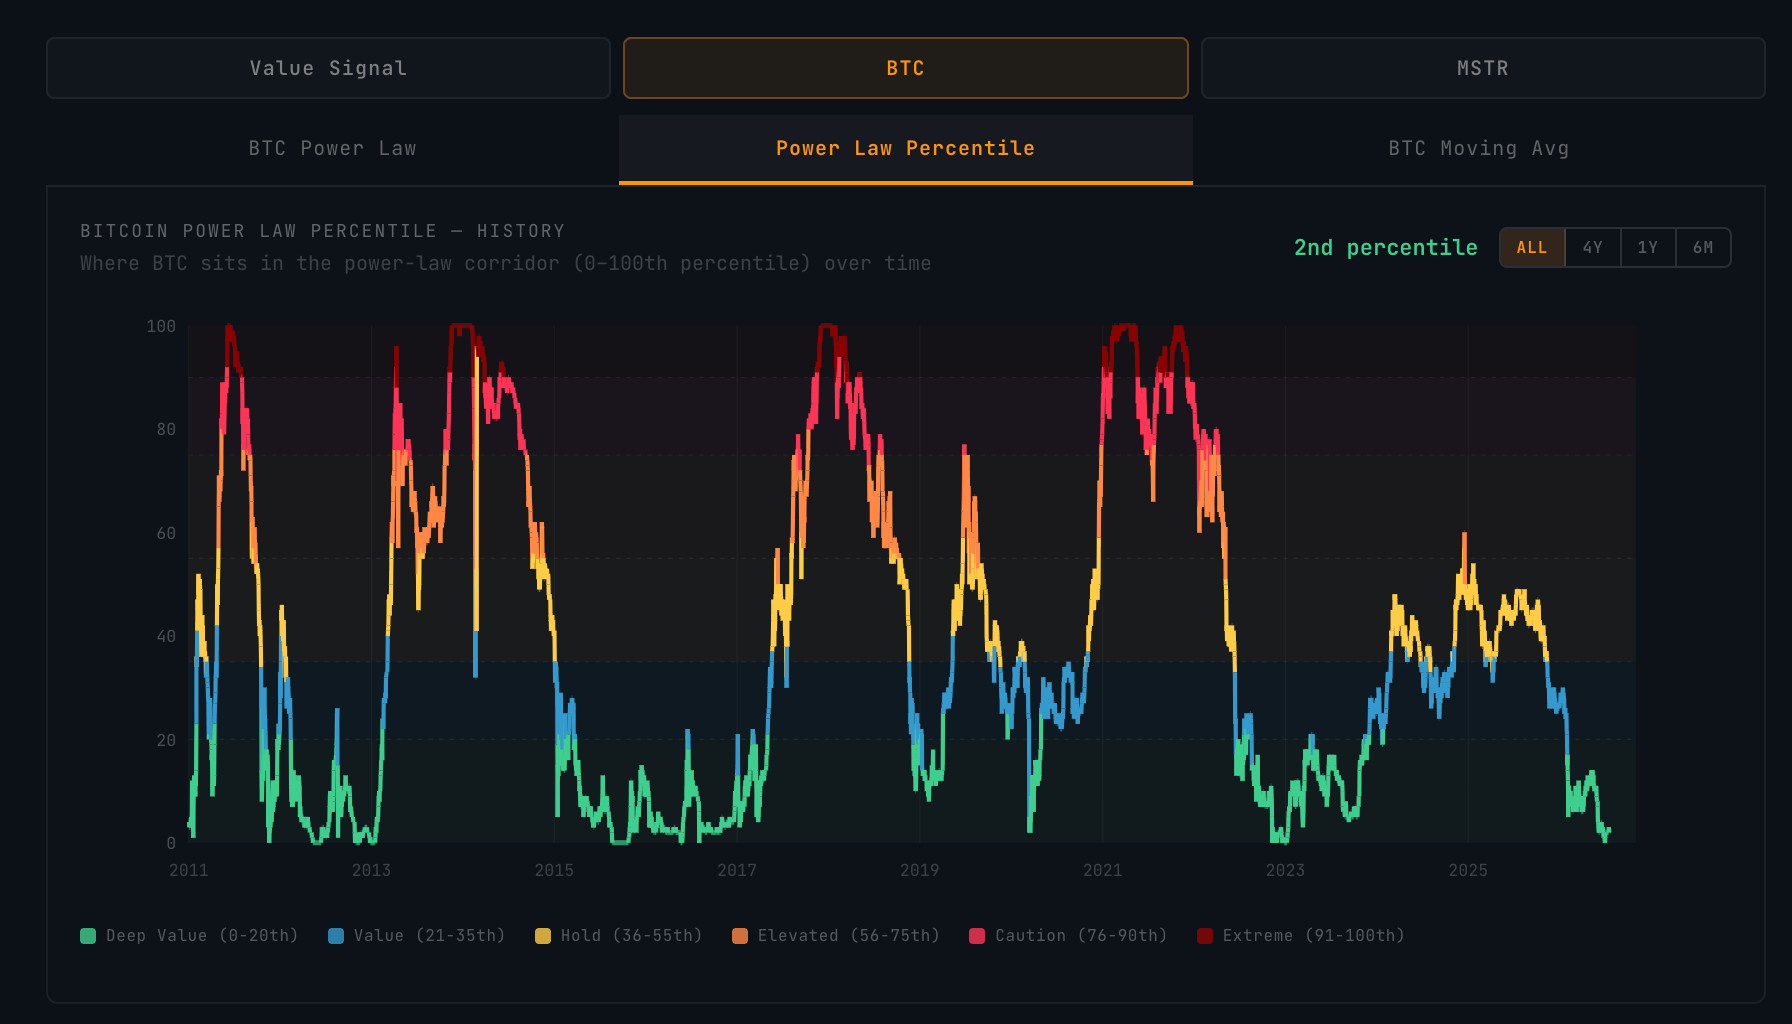
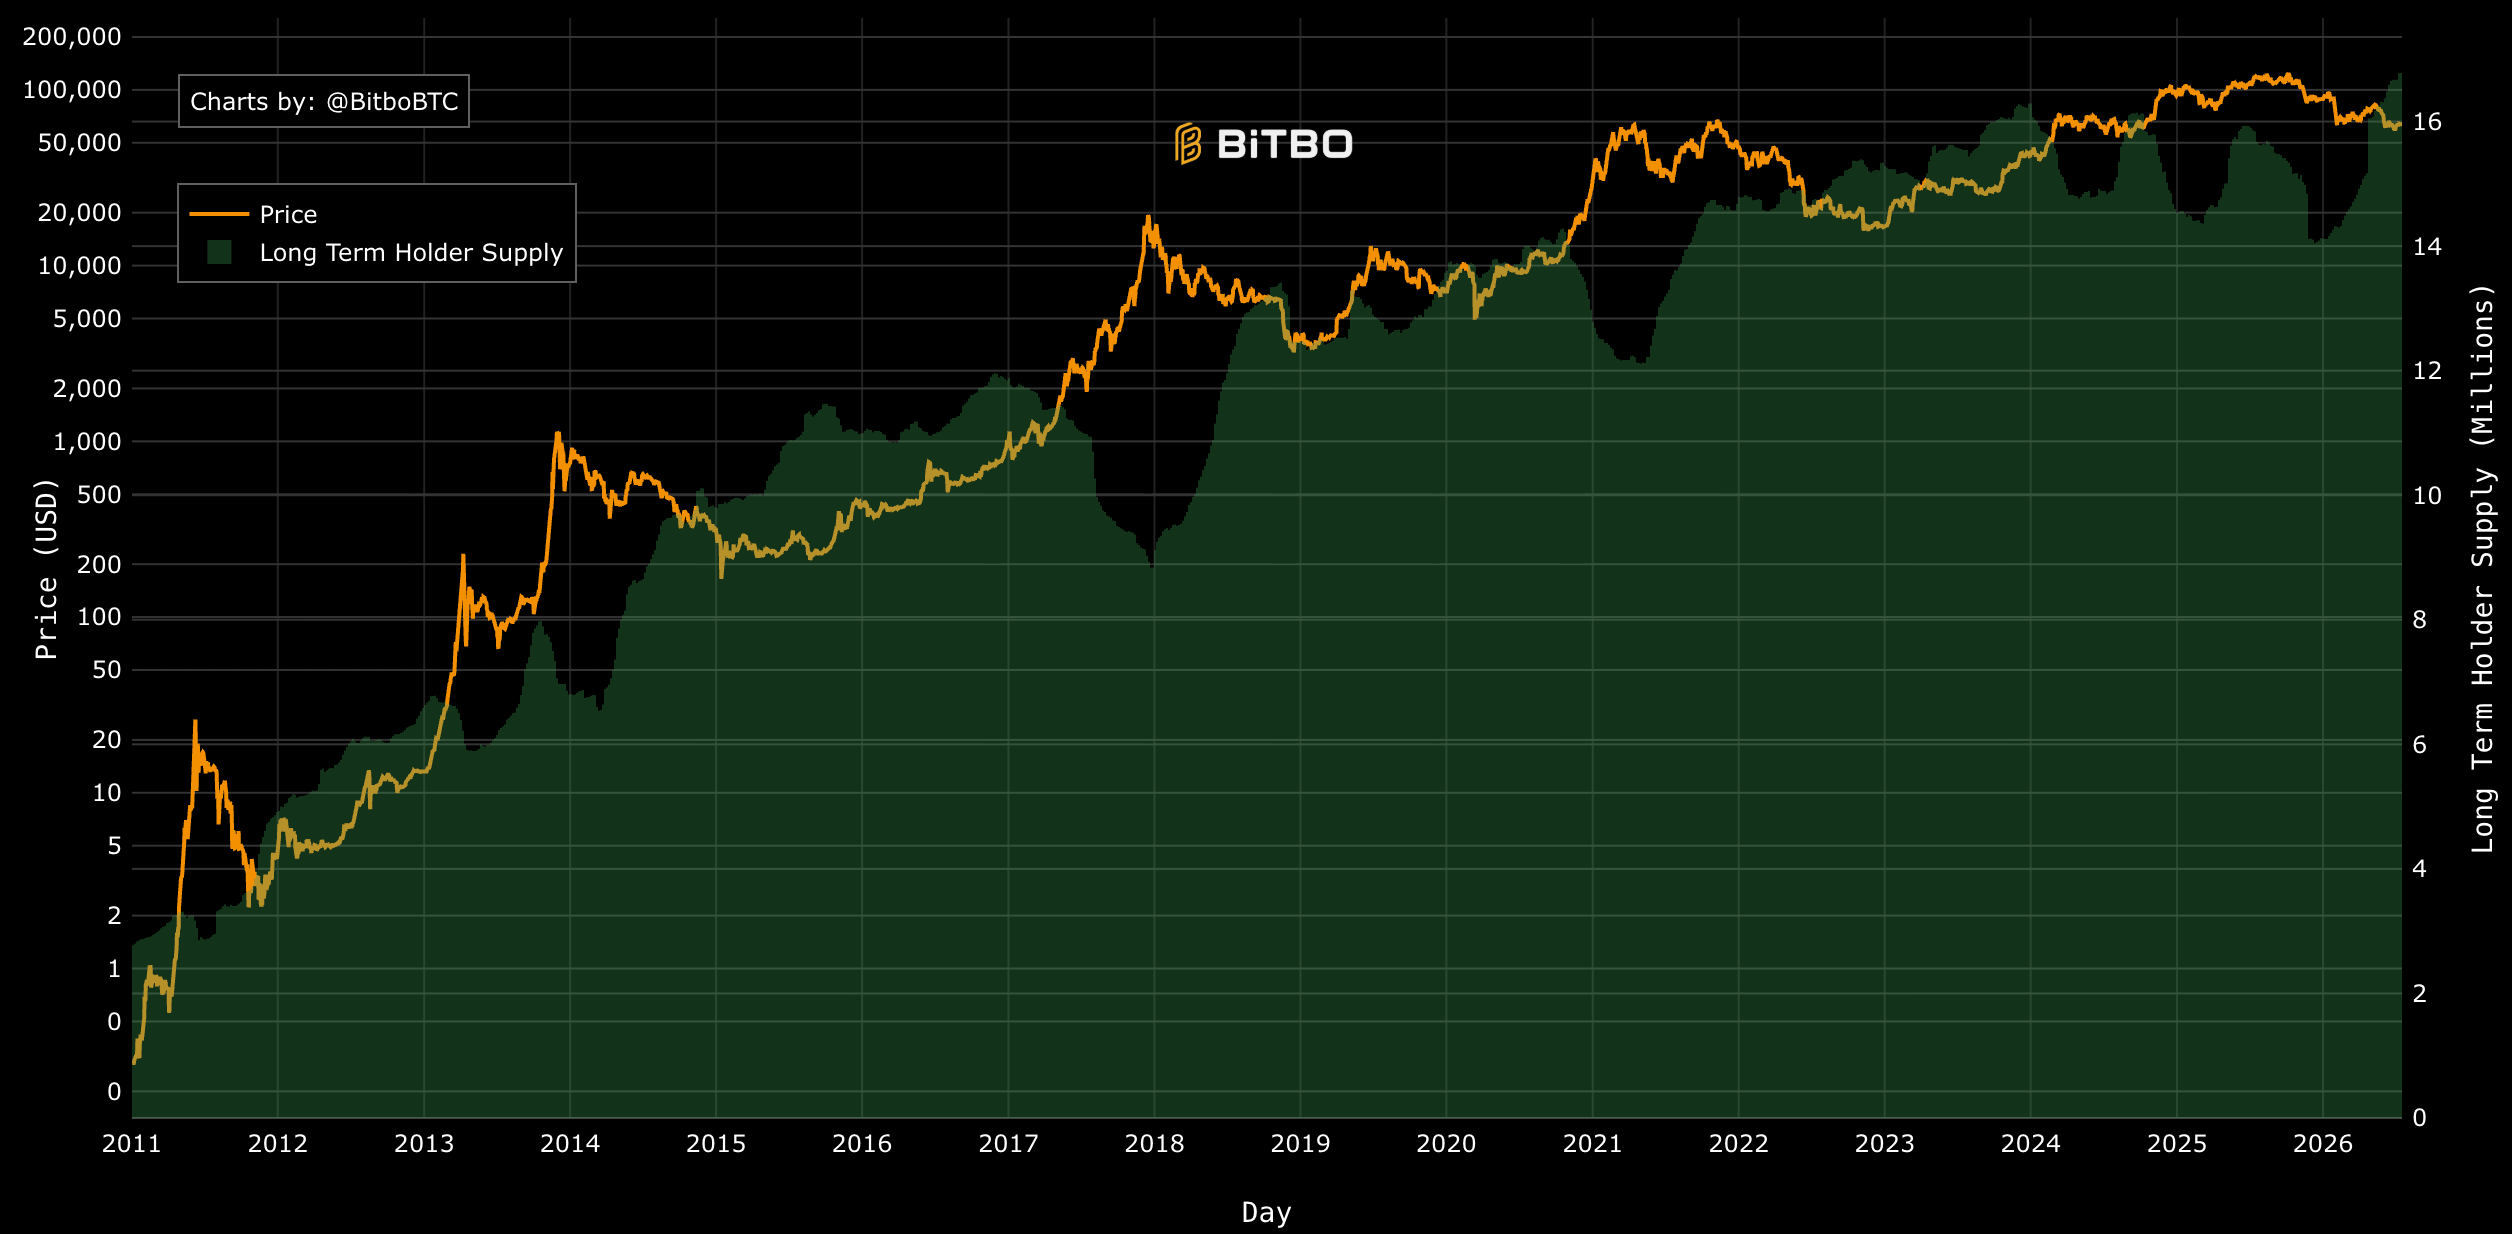
As you can see, Bitcoin has traditionally reached the 99th percentile in previous cycles (dark red zone). In the last cycle it only reached the 60th percentile. This could be for various reasons but I think the largest is that Bitcoin was finally large and liquid enough for long term holders realize gains they have been sitting on for years. Those long terms holders are now loading back up with prices as low as they are. Supply held by long term holders is now at an all time high.
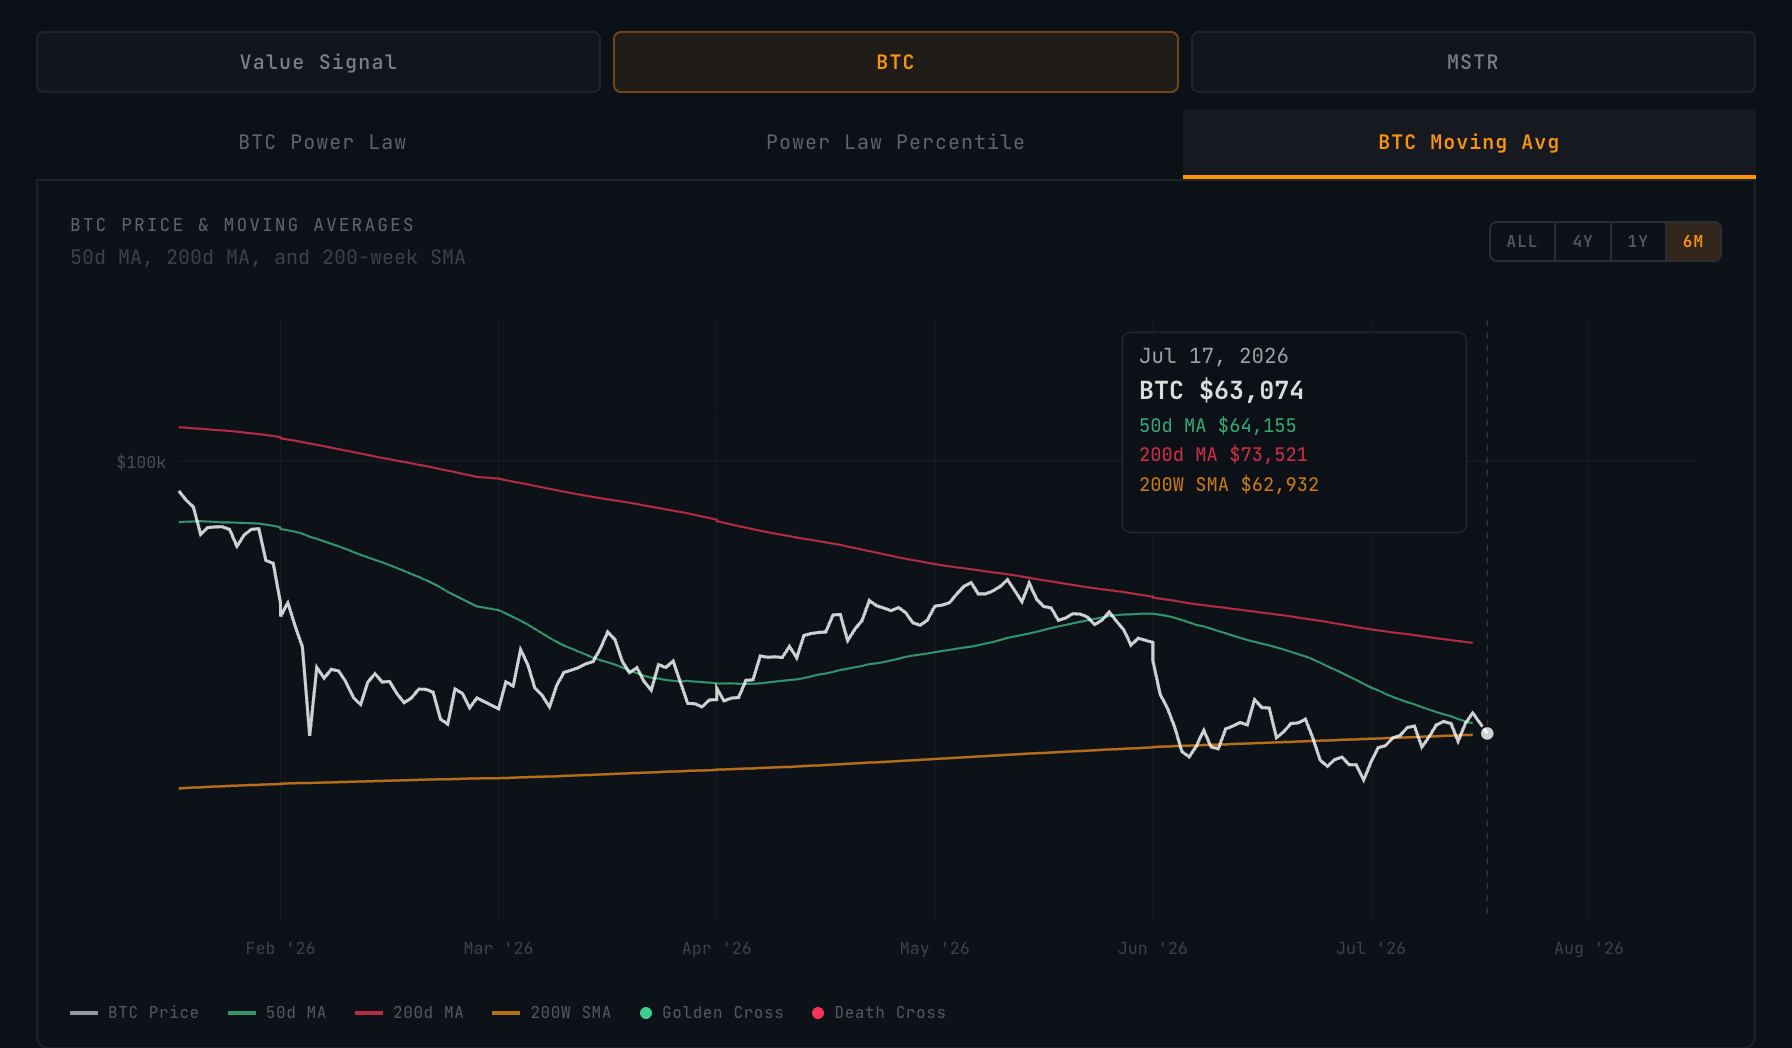
The price continues to be in a downward trend with the 50 day moving average being under the 200 day moving average. Usually when the 50d MA crosses above the 200d MA that signals that we are moving towards a bullish trend. You can see on the chart below, the green dots are where we are trending bullish and red when trending bearish.
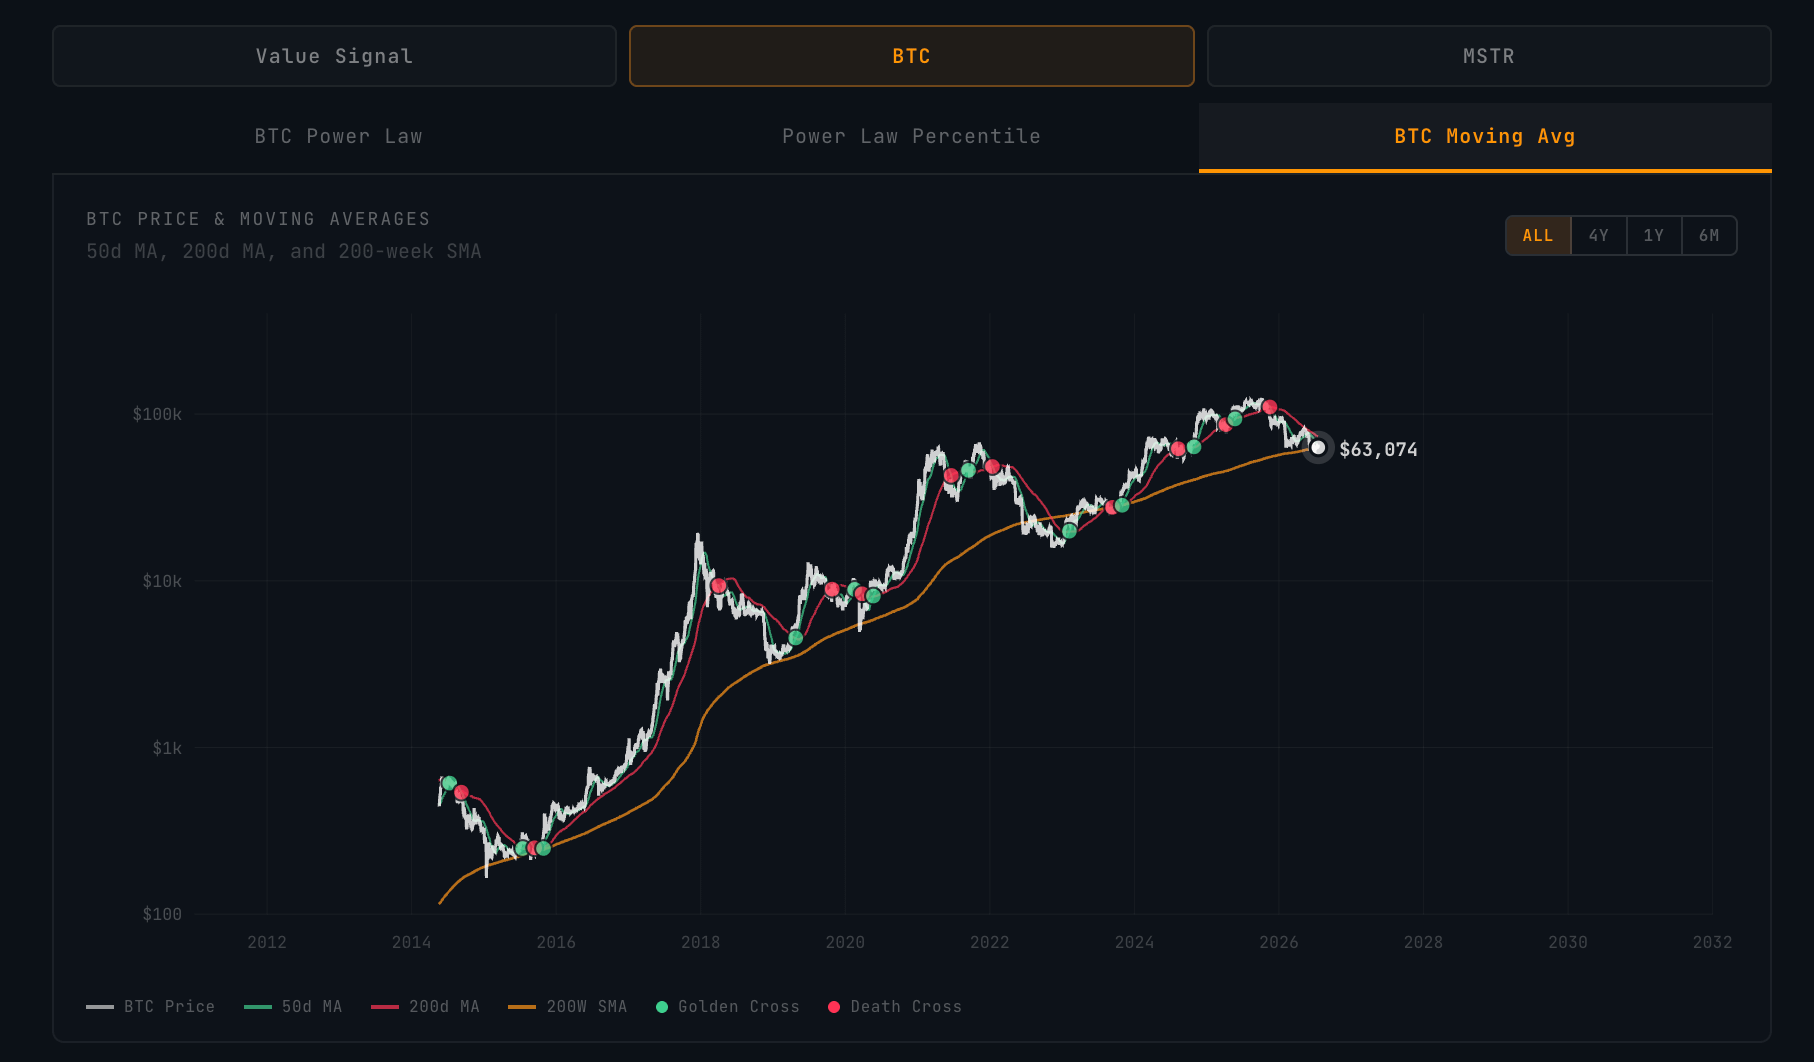
The 200 week moving average also serves as a soft zone where the price usually bottoms. The price currently sits right between the 200W MA and the 50D MA. I think from here we either break down a bit further or break above the 50D MA and move toward the 200D MA at $73k. When we do finally get the bullish cross, I believe that is the signal that the bear market is over.
Strategy (MSTR)
Strategy (MSTR) is an amplified Bitcoin equity. They hold Bitcoin as a treasury reserve asset and have various products available to acquire additional Bitcoin. MSTR is more volatile than Bitcoin (which is already very volatile). MSTR will rise and fall faster and more aggressively than Bitcoin as the price fluctuates.
The MSTR Price is generally a function of 3 things:
The current Bitcoin per Share of MSTR and how fast it is growing
The current price of Bitcoin and the value of the Bitcoin on their balance sheet
The current sentiment in the market and how much the market is valuing the company compared to it’s Bitcoin value.
MSTR can trade at a premium (or discount) to their Bitcoin net asset value. The multiple is called MNAV and the reason the company can trade at a premium is because they are increasing their Bitcoin per Share. If someone believes that Strategy will double their Bitcoin per Share, then they may be willing to pay a premium to buy the stock now. Small Bitcoin Treasury companies can trade at a higher premium since they can increase their Bitcoin per Share much faster than a company that has as large of a Bitcoin Treasury as Strategy. MNAV usually trades in line with the sentiment in the Bitcoin market. When Bitcoin price is high then MNAV is usually high and when Bitcoin price is low MNAV is generally low.
Let’s dig into what the numbers look like right now for Strategy:
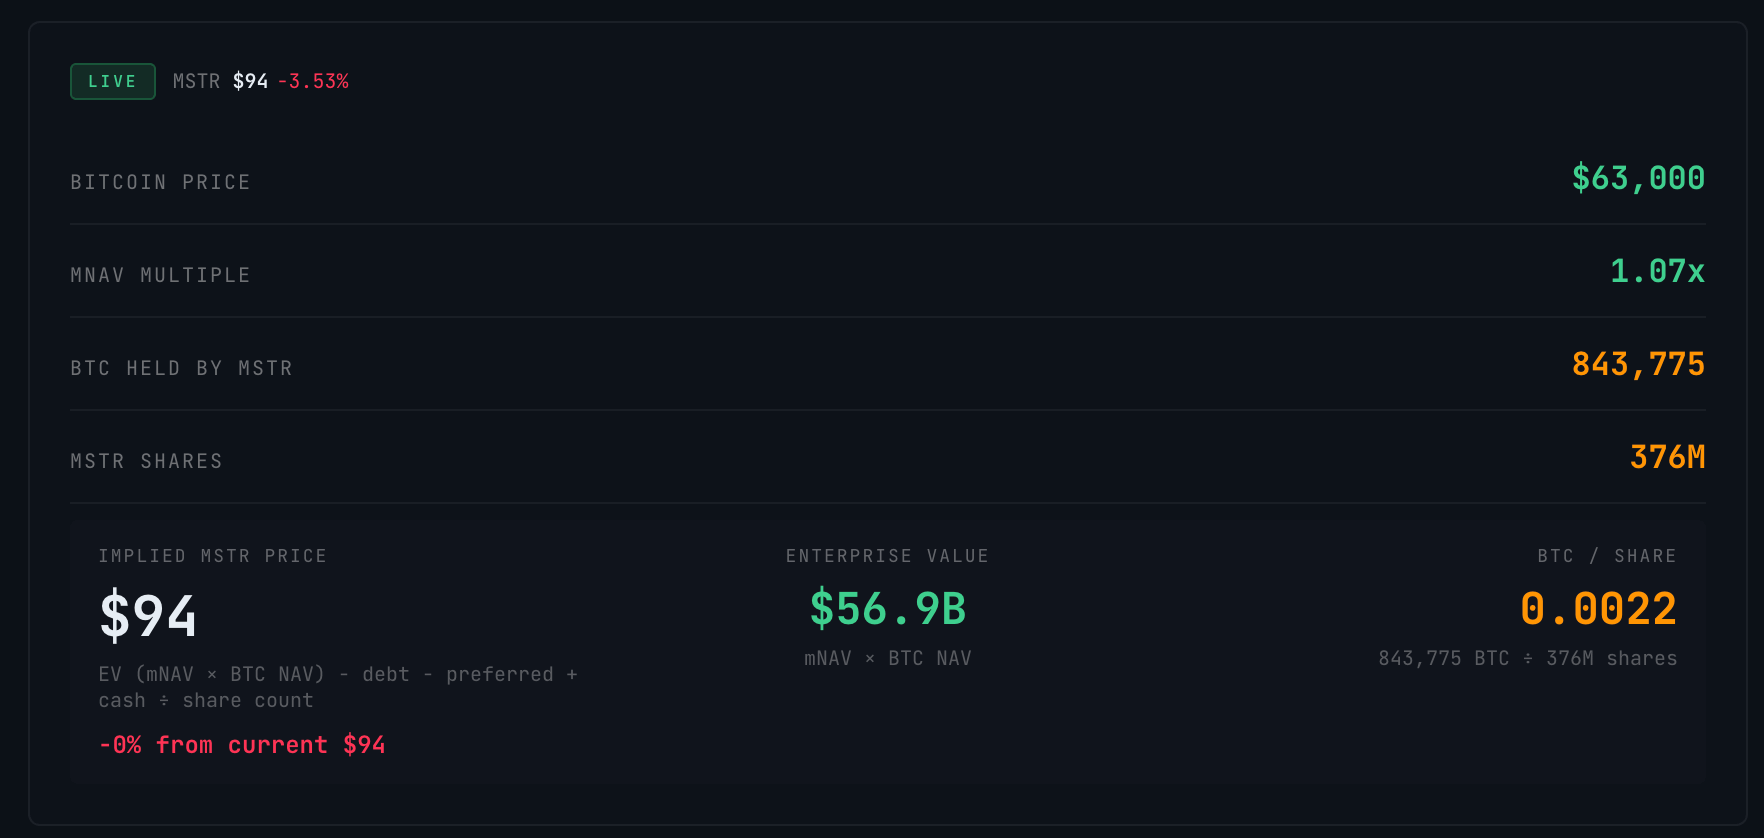
Strategy is currently trading at $94 per share, down from the all time high $543 in November 2024. Strategy holds 843,775 Bitcoin with 376 Million shares of MSTR. This comes out to a Bitcoin per share of 0.0022. As we can see, this has significantly increased since Strategy starting holding Bitcoin in 2020.
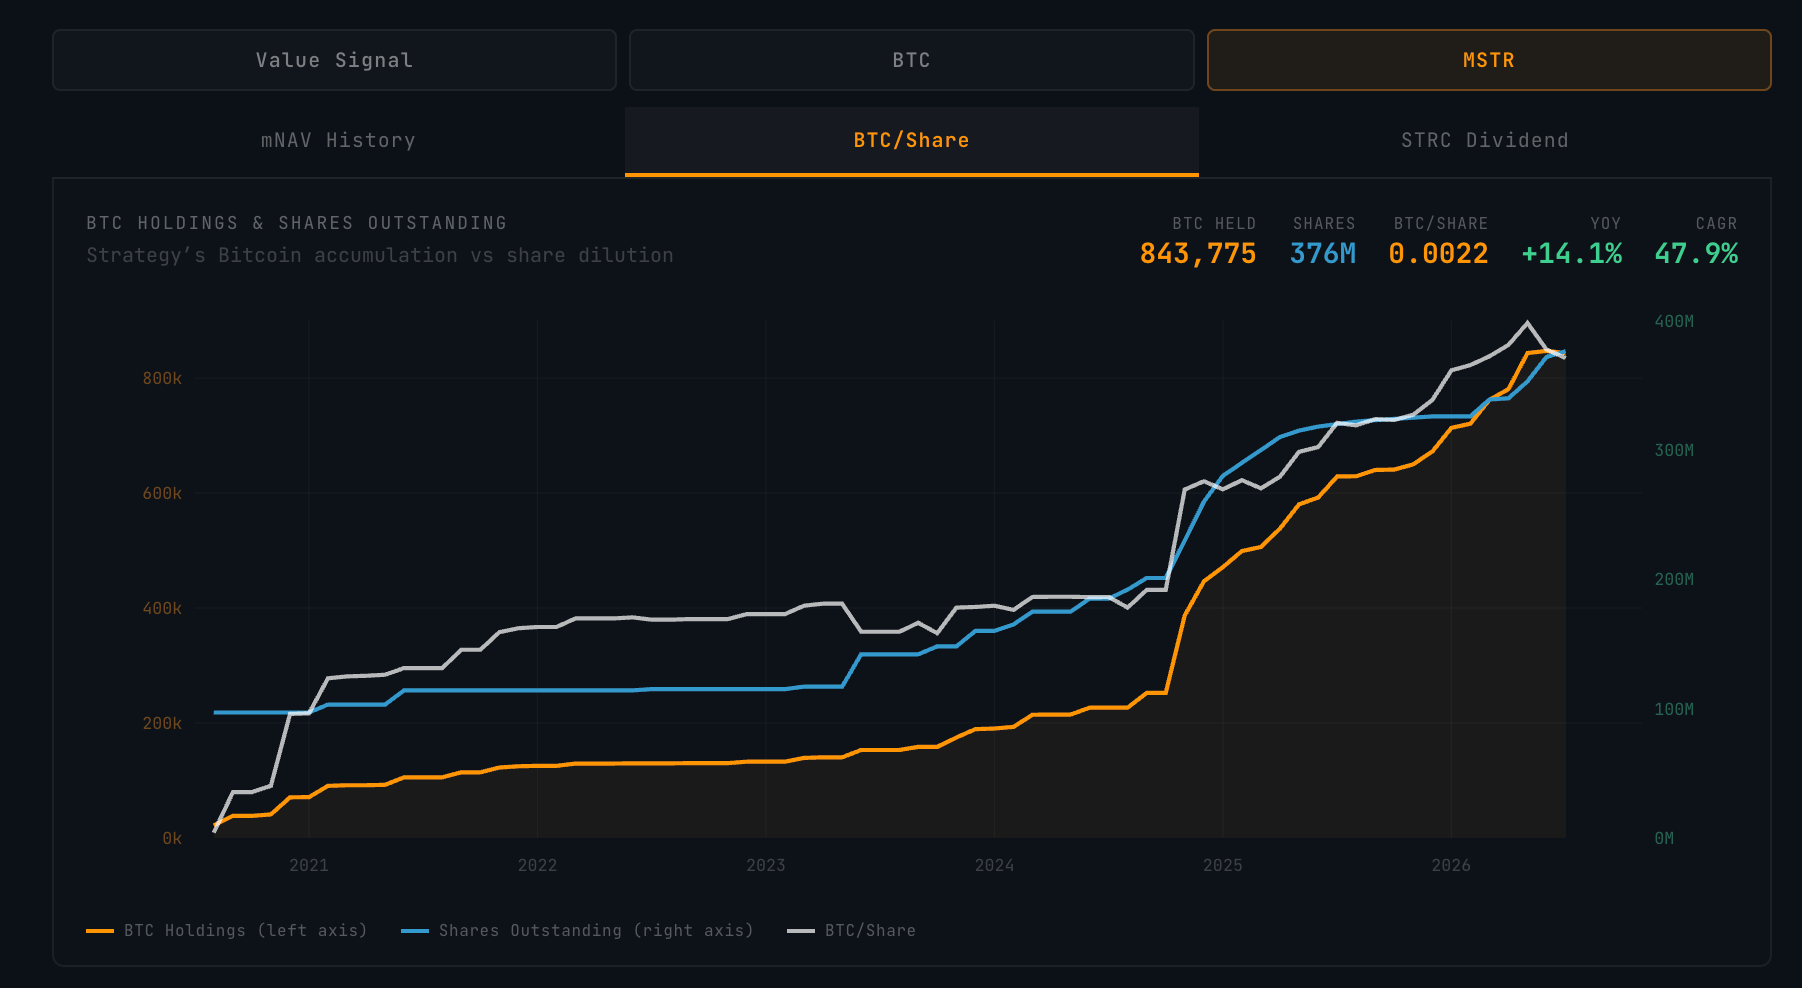
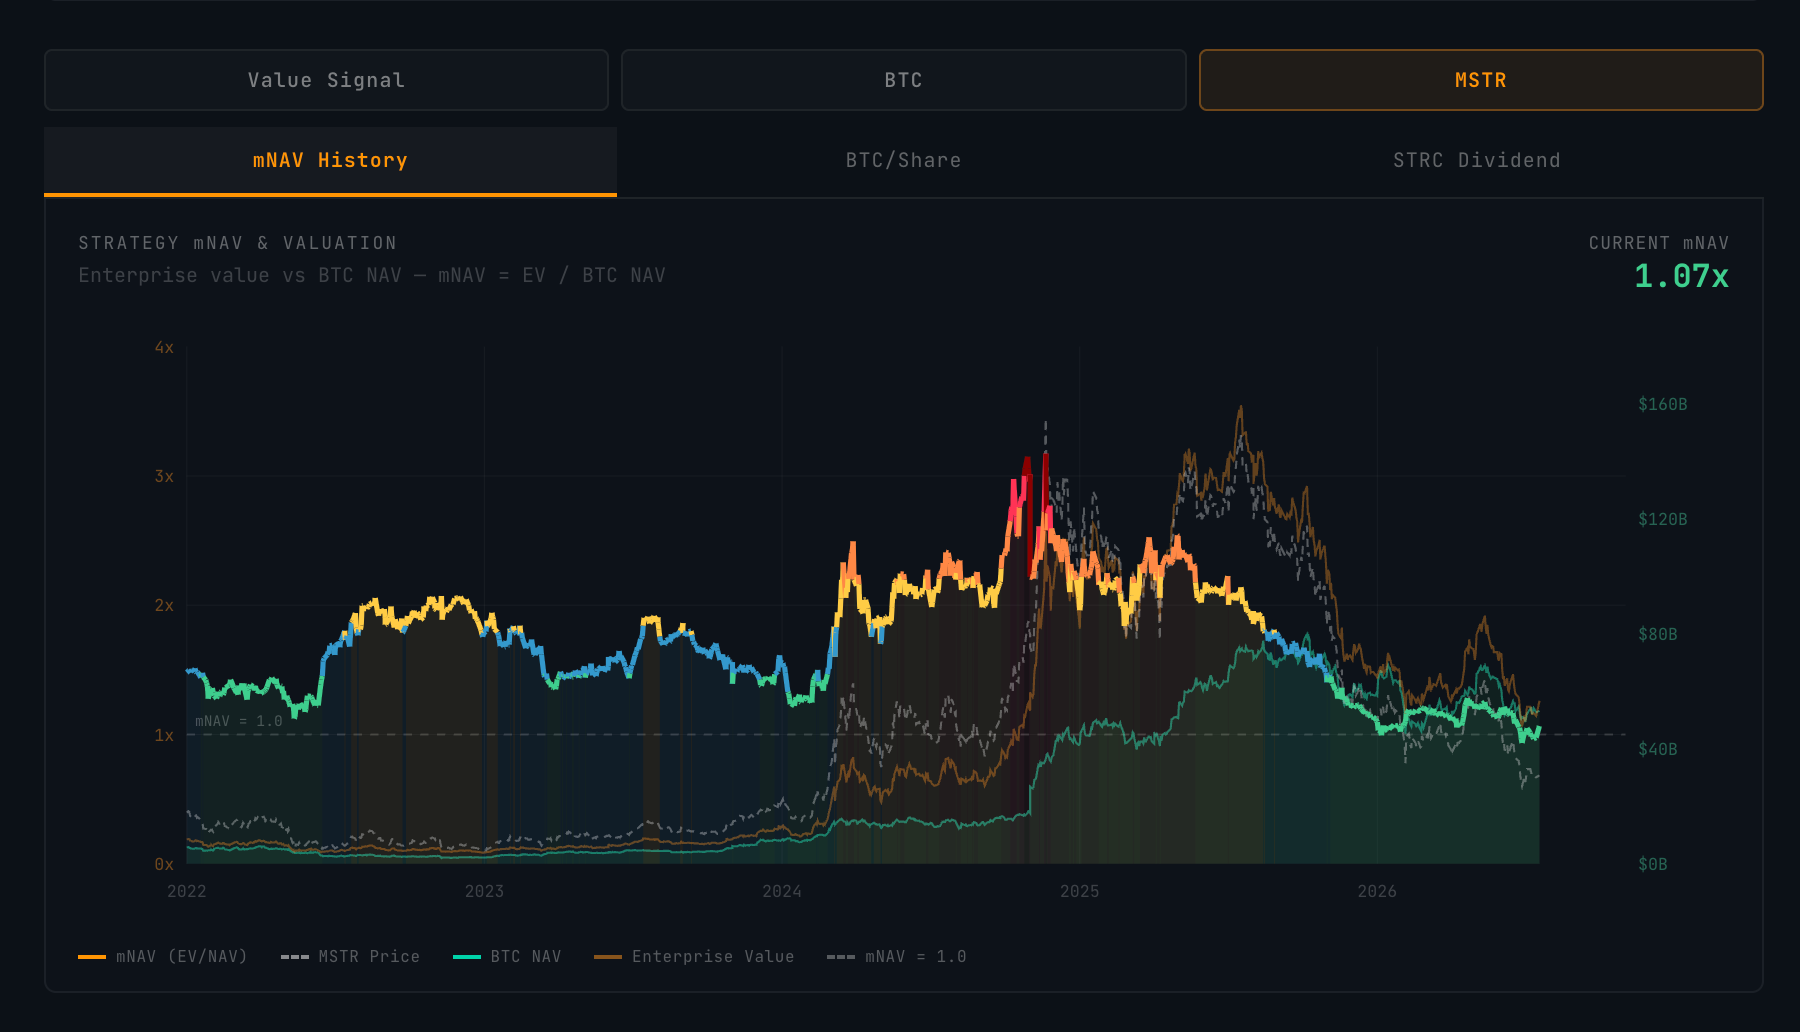
Bitcoin sentiment is extremely low given that we are at the 2nd percentile on the Power Law chart. This shows up in the MNAV which is currently at 1.07. That means MSTR is not valued at much of a premium to the Bitcoin on their balance sheet. At the hype of the market, MNAV was as high as 3.17.
We can combine the Bitcoin price and the MNAV and get a rough idea of whether MSTR is undervalued or not. This is combined into a Signal Score (65% BTC price & 35% MNAV). At the current moment, the composite value score is 96.

We can overlay this score onto the MSTR price chart and see how it has performed over time. In 2021, this accurately called the top where Bitcoin price was high relative to the trend and MNAV was also high. It also called the bottom in 2022/23 with the green deep value zone. The last cycle top was less clear as we did not get a blow off top but we did still reach the orange elevated zone.
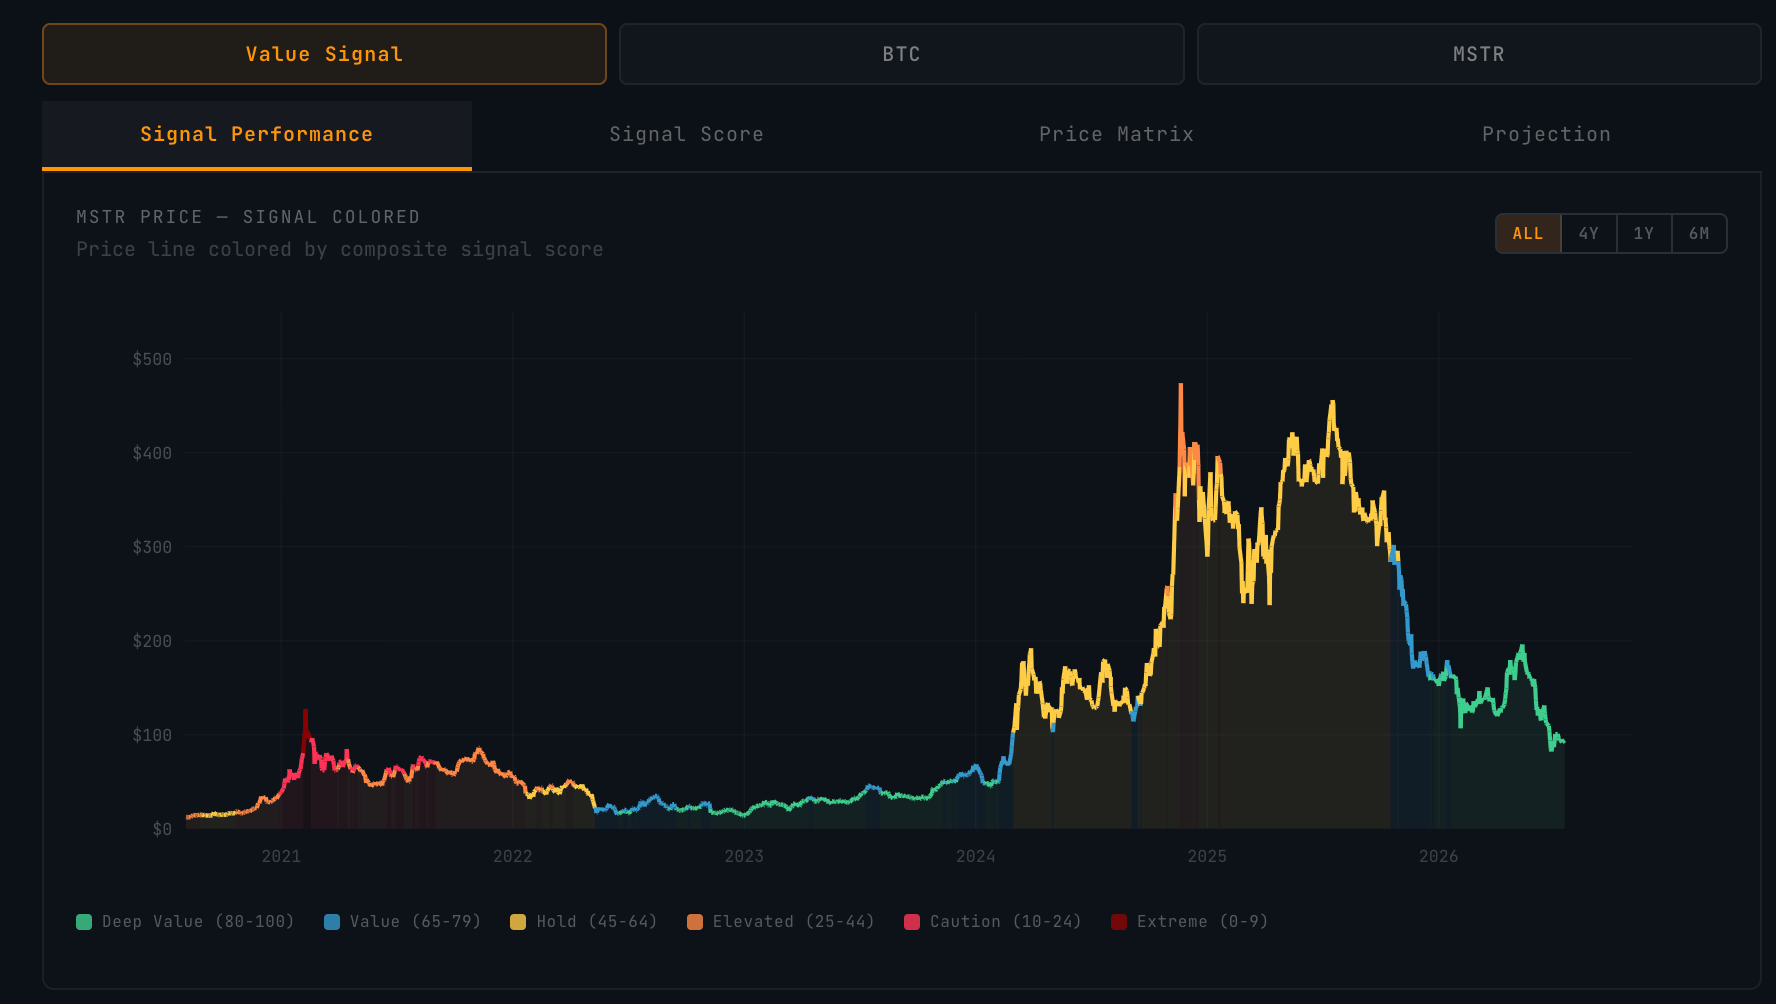
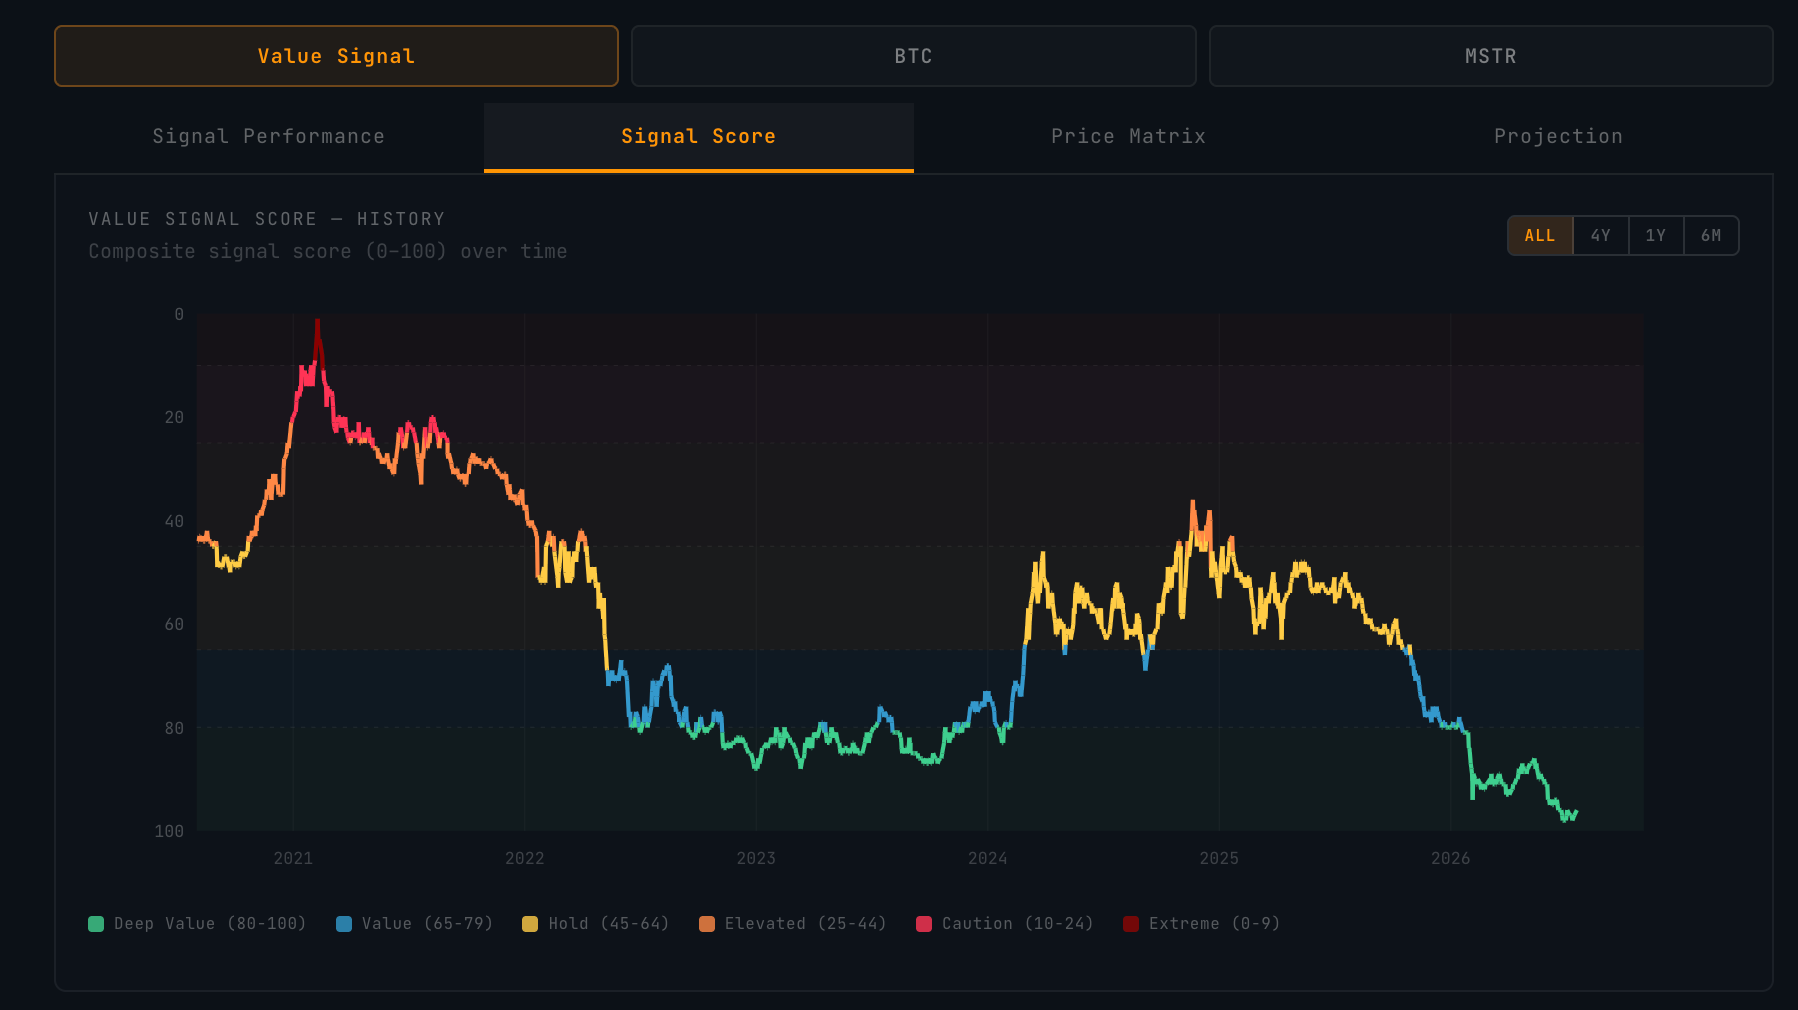
This chart is currently indicating that we are in the deep value zone for MSTR. We can look at just the score chart plotted over time and see the the value signal score is at an all time high given the price and sentiment are so low. The 2022/23 bear market only got to a score of about 88 as the MNAV remained elevated throughout the bear market. We just hit a high score of 98 at the end of June.
Projection
So now that we know we are in a high value zone for both BTC & MSTR, where do we go from here? We can adjust different numbers and project where the price for both may go.
For these assumptions, let’s assume the BTC per Share of MSTR stays the same. I think that this will actually go up over time (and must go up in order to maintain an MNAV over 1) but for simplicity let’s leave it unchanged for now.
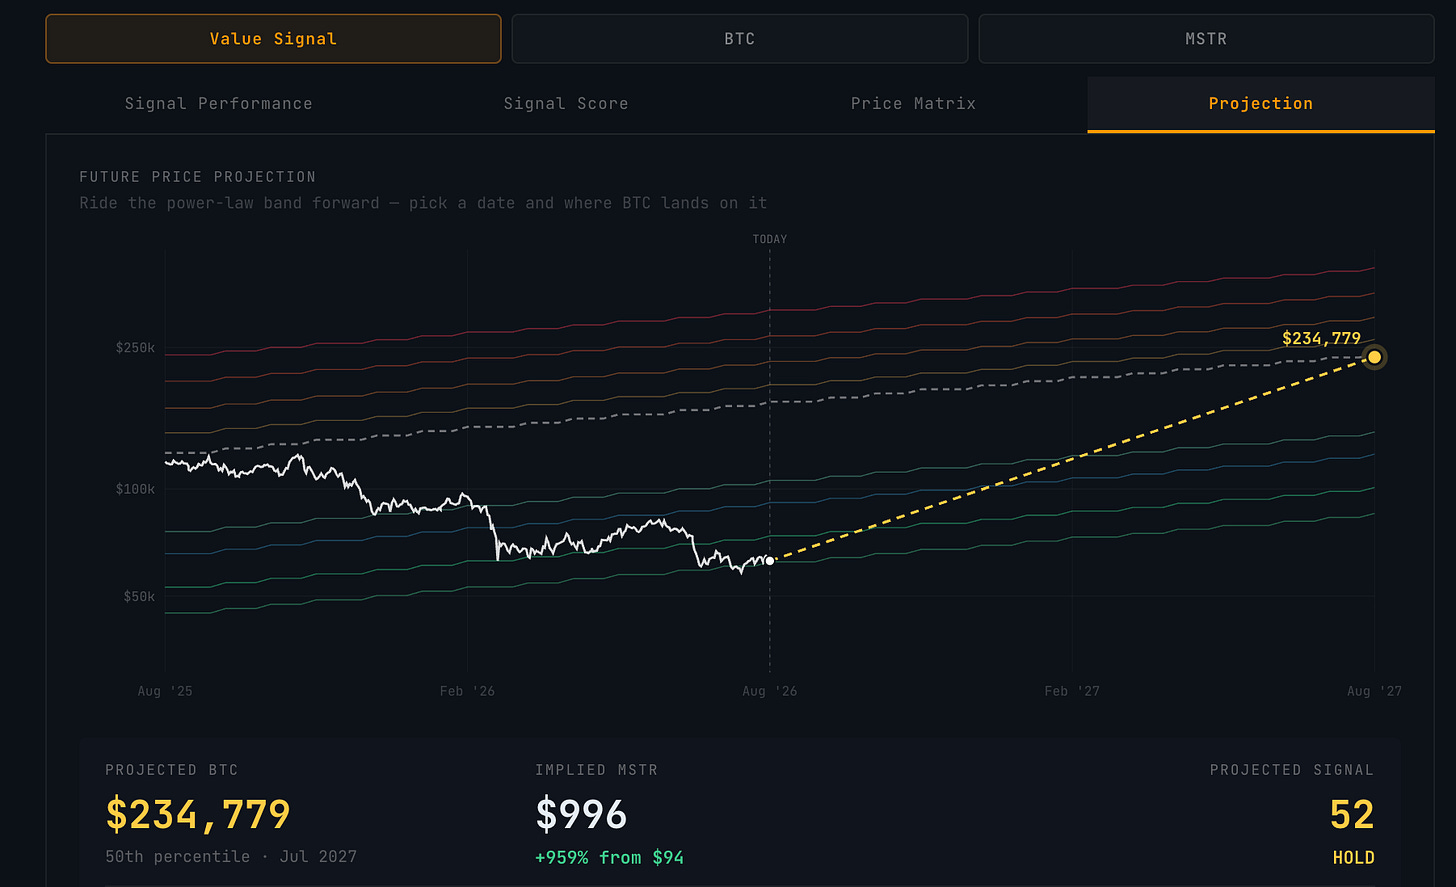
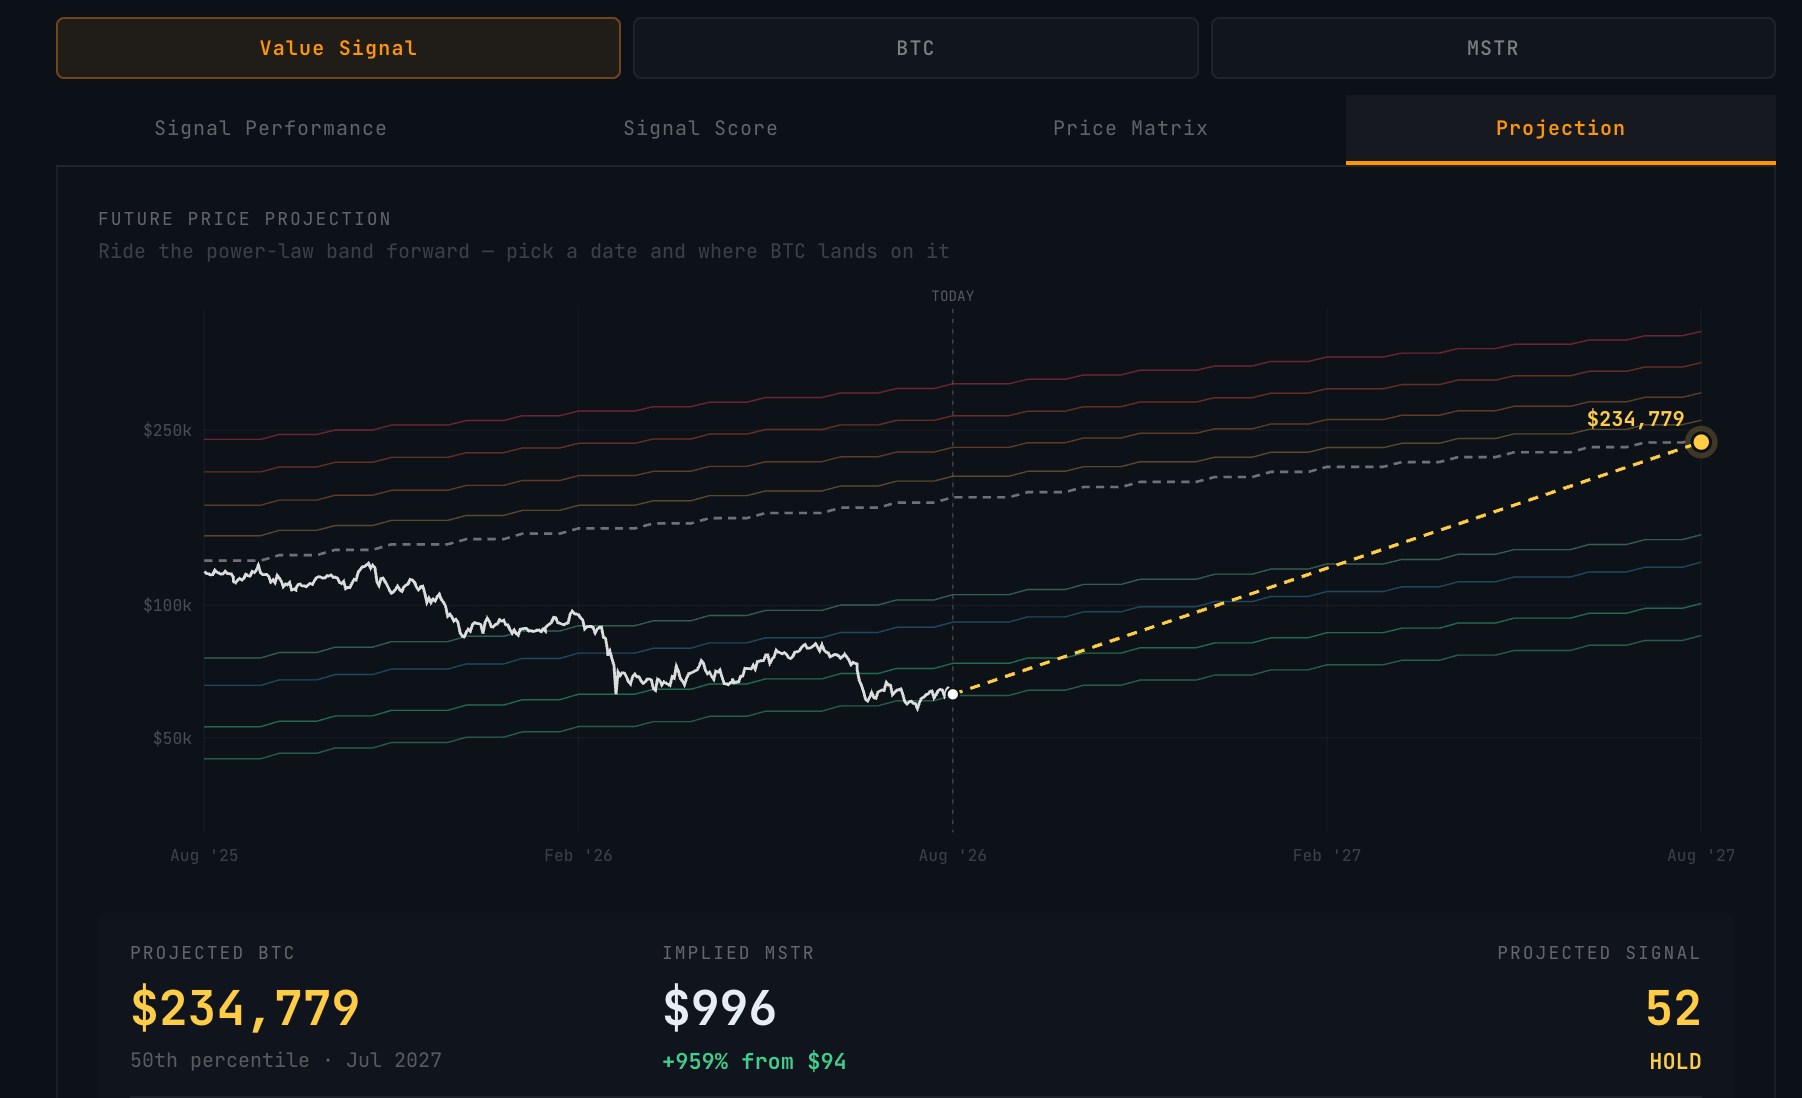
Let’s assume in a year that Bitcoin returns back to the 50th percentile on the Power Law chart. So let’s set the time to July 2027, Power Law Percentile to 50, and MNAV to 2. With these parameters, the Bitcoin price is $234k and MSTR price is about $1k. That is around 3.7x in BTC price and 10x in MSTR price.
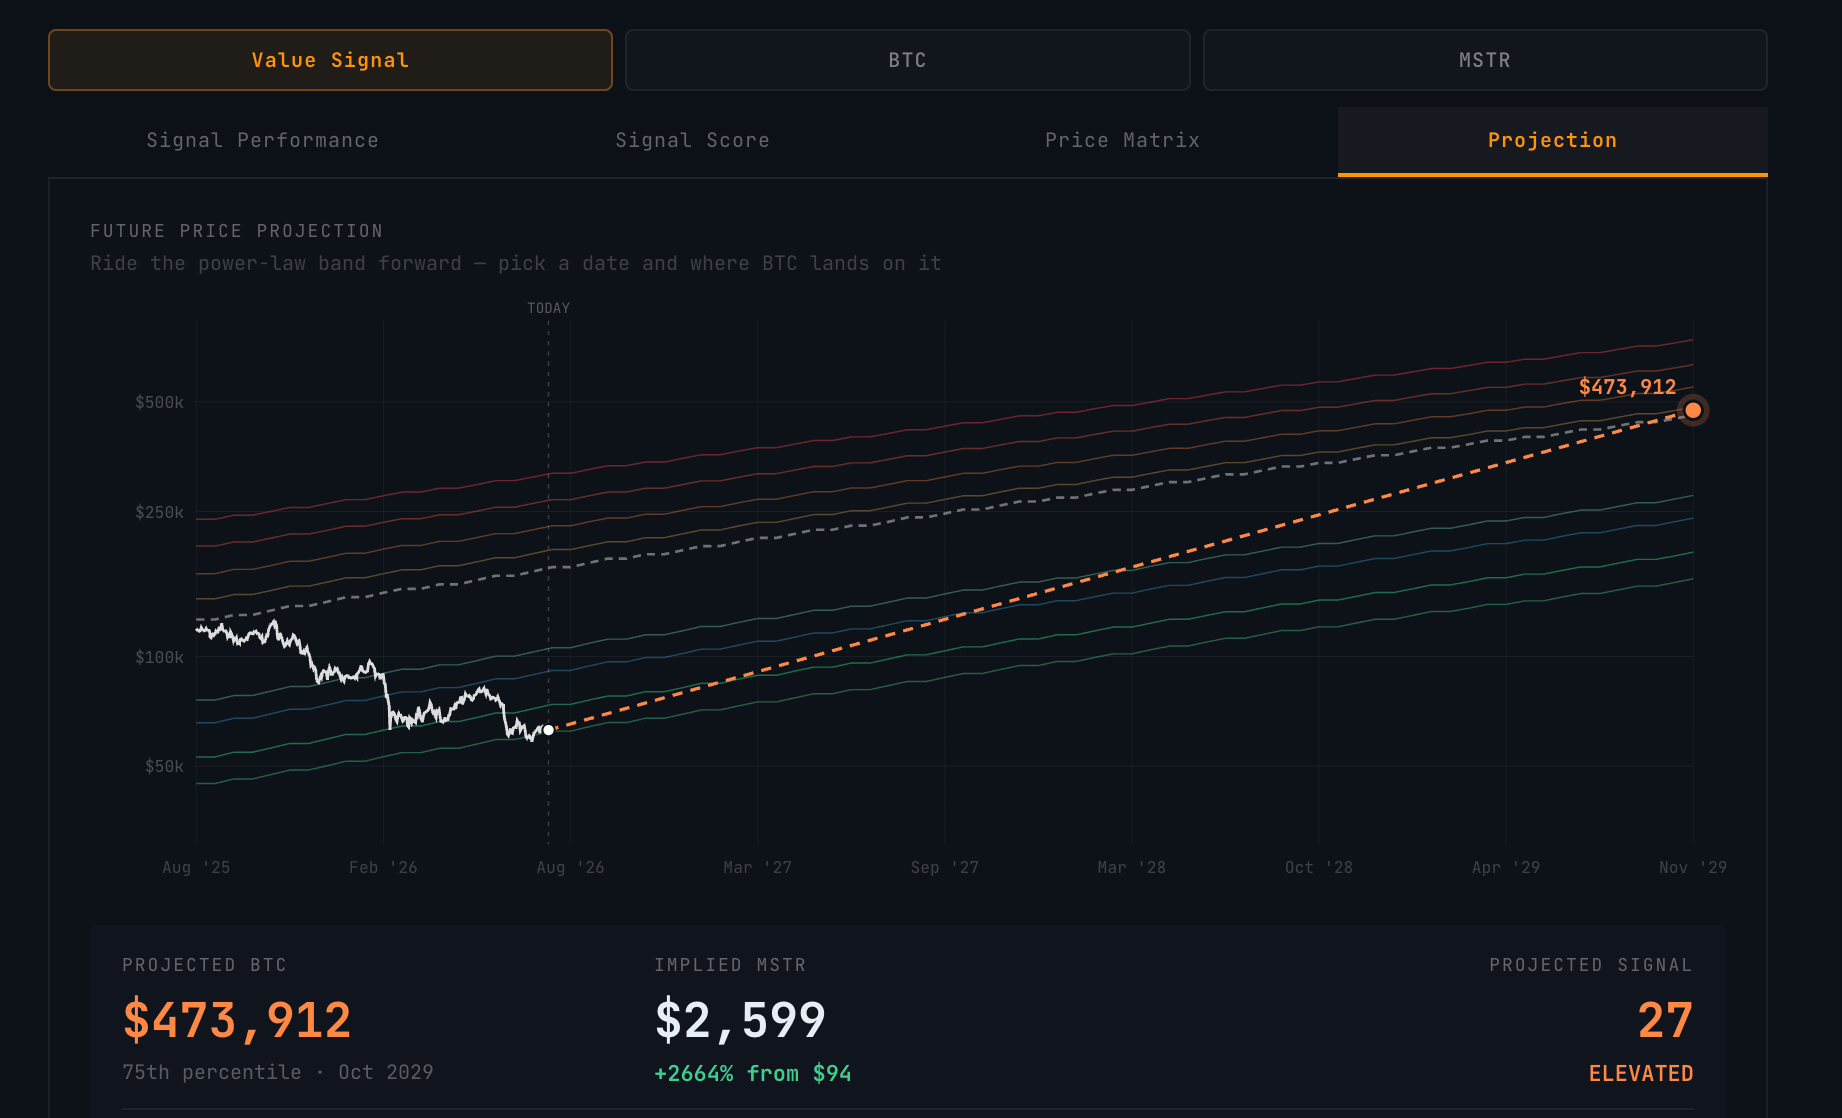
Now let’s set the time to October 2029 which follows the 4 year cycle topping timeline. Let’s say Bitcoin reaches the 75th percentile on the Power Law Percentile and MNAV to 2.5. With these parameters, the Bitcoin price is $473k and MSTR price is about $2.6k. That is around 7.5x in BTC price and 26x in MSTR price.
Finally, let’s leave time the same, Power Law Percentile to overheated 99, and MNAV to 3.15. With these parameters, the Bitcoin price is $725k and MSTR price is about $5k. That is around 11.5x in BTC price and 50x in MSTR price.
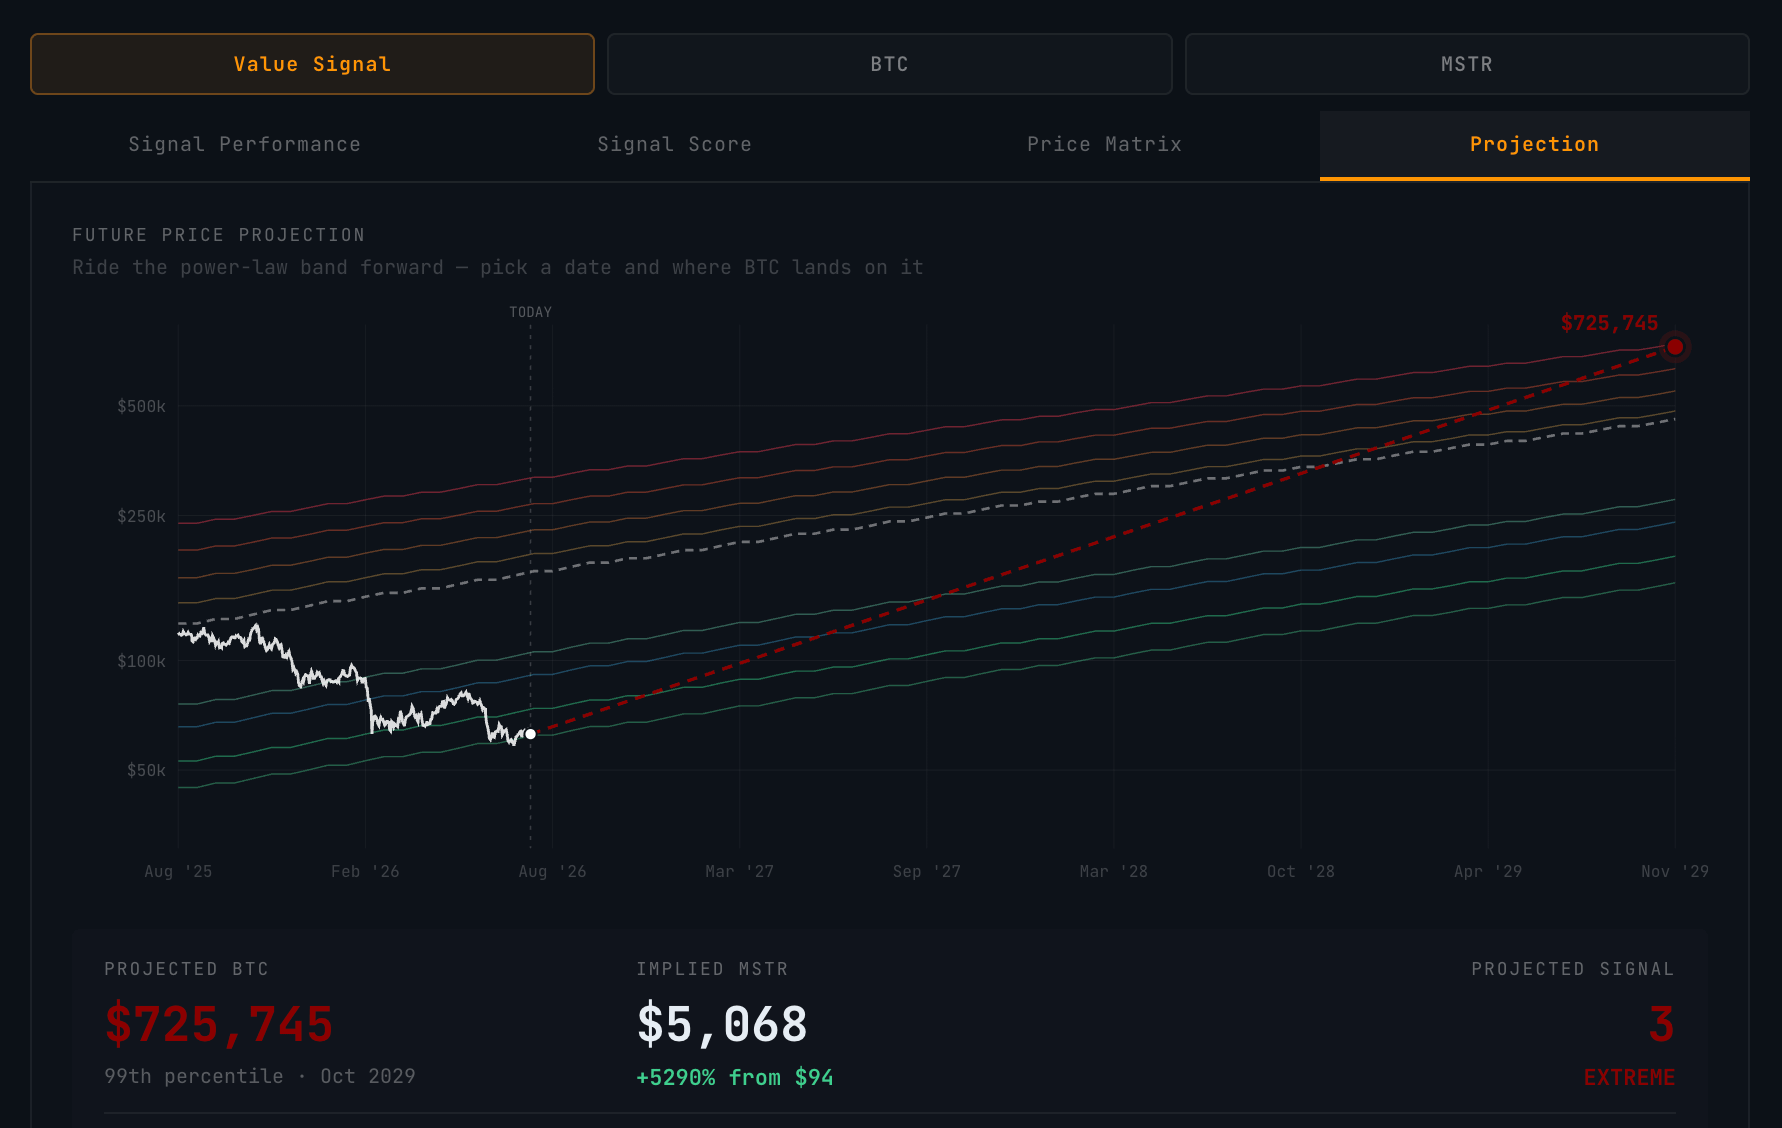
So even if Bitcoin does not reach the 99th percentile range, there is huge opportunity at this range for both BTC & MSTR. Remember that this does not even account for the fact the Strategy could (and most likely will) increase their Bitcoin per Share significantly. Even if the price does return back to the mid $50k level for BTC in the short term, BTC & MSTR will be in an even deeper value zone.
-AG